CLR Profiler enables you to look at the managed heap of a process and investigate the behavior of the garbage collector. Using the various views in the tool, you can obtain useful information about the execution, allocation, and memory consumption of your application. CLR Profiler is not a starting point for analyzing problems. Rather, it helps you identify and isolate problematic code and track down memory leaks.
The analysis component of the profiler uses the TraceEvent library to generate a report that helps you drill down in to the problems in matter of a few minutes. It should be noted that no changes are made to your Web App code or your configuration during the collection or the analysis phase. In fact, the web app is not even restarted as a result of capturing this trace. The captured trace has ETW events emitted by the IIS and the ASP.NET providers along with stack traces captured at the CPU level. You can use this tool to efficiently troubleshoot delays which are relatively small (less than a second too) without impacting the run-time performance of the application. The profiler works for both ASP.NET and ASP.NET core applications.
How to collect the .NET Profiler Trace?
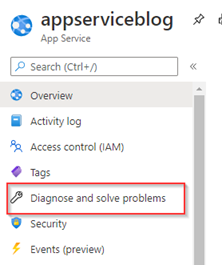
Go to App Service Menu, once you have accessed your application, search for “Diagnose and Solve Problems”.
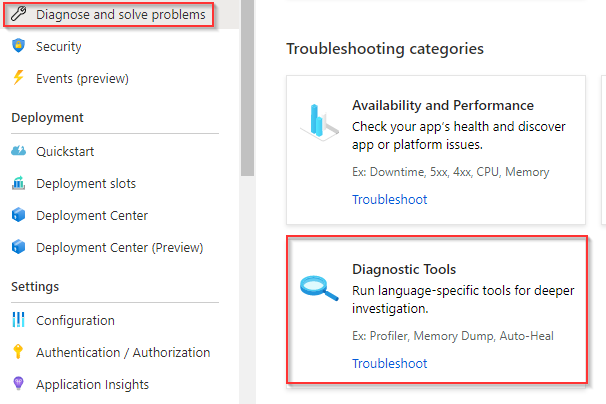
Click on “Diagnostics Tools”.
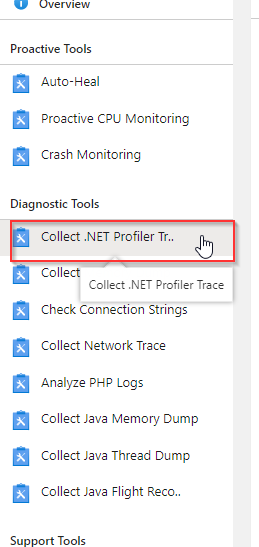
On the Diagnostics Tools on the left side we will be able to see some tools to collect data on the app services, please select “Collect .NET profiler Trace”
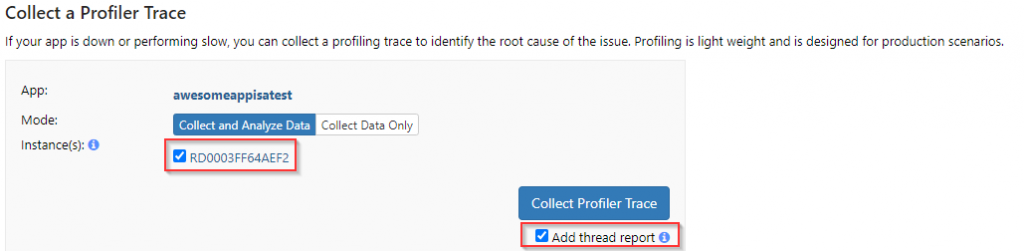
Select the instances and select “add thread report”. Then Click on the “Collect Profiler Trace”
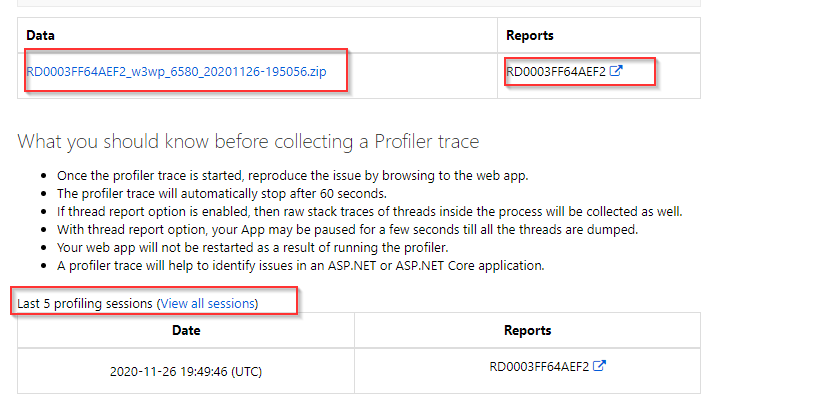
After the analysis is completed, you will notice two files once that is .diagsession that will help to investigate on your end the profile file and in addition the .html that contain that analysis of the .diagsession file. You can also see the last 5 sessions captured.